India’s education system has undergone significant transformation in recent years, with notable growth across both higher education and school education sectors. Let me explain the key statistics you’ve shared and what they mean for India’s educational journey.
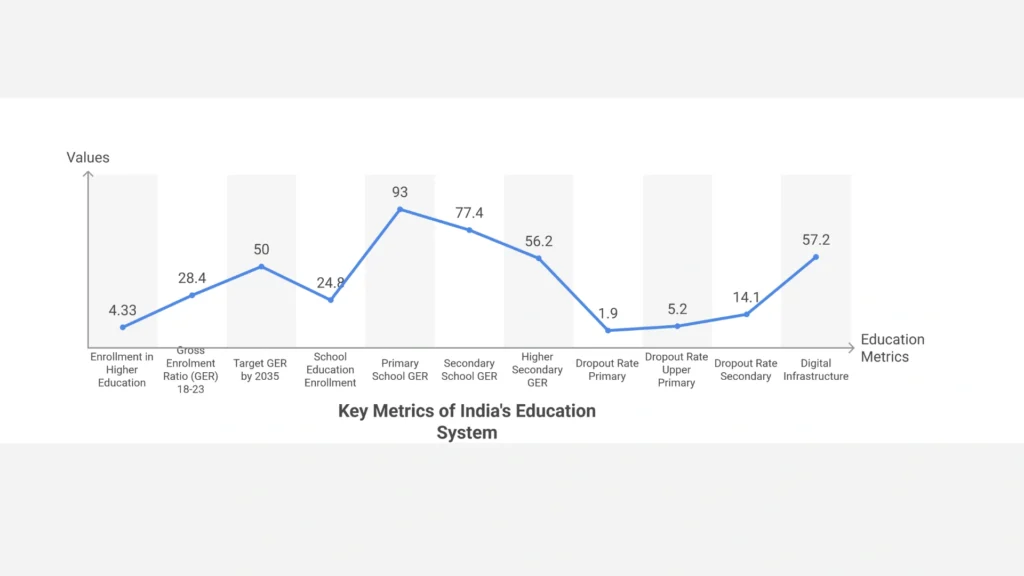
Table of Contents
Growing Enrollment Numbers
The figure of 4.33 crore (43.3 million) students enrolled in higher education represents a massive educational ecosystem. The 26.5% increase since 2014-15 indicates that approximately 9 million additional students have entered higher education over this seven-year period. This growth reflects both improved access to higher education and greater societal emphasis on pursuing degrees beyond secondary schooling.
Understanding Gross Enrollment Ratio (GER)
The GER is a crucial metric that shows what percentage of the eligible age group (18-23 years in this case) is enrolled in higher education. The increase from 23.7% to 28.4% means that India is steadily moving toward having more than one-fourth of its young adult population pursuing higher education. However, this also means that nearly three-fourths of the eligible population still doesn’t access higher education.
The Ambitious 50% GER Target
Setting a target of 50% GER by 2035 represents a bold aspirational goal that would fundamentally transform India’s knowledge economy. Achieving this would require nearly doubling the current enrollment rates, necessitating massive investments in infrastructure, faculty development, and accessibility measures. If achieved, it would place India closer to advanced economies in terms of higher education penetration.
School Education Framework
The Scale of School Education
With 24.8 crore (248 million) students across 14.72 lakh (1.472 million) schools, India operates one of the largest school education systems in the world. To put this in perspective, the number of students in India’s school system exceeds the entire population of most countries. This massive scale creates both opportunities and challenges for educational policy and implementation.
Teacher Resources
The 98 lakh (9.8 million) teachers supporting this system represent a significant workforce dedicated to education. The student-teacher ratio that can be derived from these numbers (approximately 25:1) provides insight into classroom dynamics and the resources available for individualized attention.
Government vs. Private School Dynamics
The distribution between government and private schools reveals an interesting pattern. Government schools constitute over two-thirds of all institutions but serve only half of the student population. Conversely, private schools, while fewer in number (22.5% of institutions), serve a disproportionately large share of students (32.6%). This suggests that private schools typically have larger class sizes or more students per institution than government schools. It also indicates that many families are choosing to invest in private education despite the availability of government options.
Educational Progression Through Levels
Primary Education Success
The 93% GER for primary education shows that India has nearly achieved universal enrollment at the foundational level. This represents successful implementation of policies aimed at getting children into school initially.
The Narrowing Pipeline
As we move up the educational ladder, the GER drops significantly—from 93% at primary to 77.4% at secondary and further down to 56.2% at higher secondary levels. This illustrates the “narrowing pipeline” phenomenon, where progressively fewer students continue their education at each subsequent level. The substantial drop between primary and higher secondary (a decrease of nearly 37 percentage points) highlights critical transition points where students are being lost from the educational system.
Improving Retention
The decreasing dropout rates across all levels (1.9% for primary, 5.2% for upper primary, and 14.1% for secondary) show positive trends in retaining students. However, the cumulative effect of these dropout rates still results in significant attrition by the time students reach higher education eligibility.
Digital Transformation in Education
Bridging the Digital Divide
The increase in computer availability from 38.5% to 57.2% of schools represents substantial progress in digital infrastructure development. This nearly 50% improvement over just four years (2019-20 to 2023-24) suggests accelerated efforts to modernize educational delivery systems, likely catalyzed in part by the COVID-19 pandemic which highlighted the importance of digital learning capabilities.
Implications for Educational Equity
While the overall increase in computer availability is encouraging, these statistics don’t reveal potential disparities between urban and rural schools or between different socioeconomic regions. The remaining 42.8% of schools without computers may represent more marginalized communities, pointing to ongoing digital divide challenges.
Interconnected Challenges and Opportunities
These statistics paint a picture of an education system in transition—making significant progress while still facing substantial challenges. The relationship between school education metrics and higher education aspirations is particularly noteworthy. For India to achieve its ambitious 50% higher education GER target, it must first address the narrowing educational pipeline and ensure more students successfully complete higher secondary education.
The improving digital infrastructure provides opportunities for innovative teaching methods and expanded access, potentially helping to address some of the traditional barriers to education progression. However, ensuring that these technological advances benefit all students equally remains a critical challenge.
In summary, India’s education landscape shows promising development with substantial recent improvements, but the path to achieving its ambitious goals will require sustained focus on both expanding access and enhancing quality across all educational levels.